The Numbers
Understanding the units
- ng/L = nanograms per litre (a billionth of a gram in a litre of water). For comparison, the EU drinking water safety limit for PFAS is 100 ng/L.
- µg/kg = micrograms per kilogram (a millionth of a gram per kilogram of soil)
- kg/year = kilograms per year
About the EU drinking water standard comparison
Throughout this page, we compare measured PFAS concentrations to the EU drinking water standard (100 ng/L). Important context:
- The measurements shown are from industrial discharge water, not drinking water at the tap
- The EU drinking water standard (Directive 2020/2184) applies to treated drinking water supplied to consumers
- We use this comparison because it is the most widely understood benchmark for PFAS contamination — it provides a reference point that helps illustrate the scale of detected concentrations
- This comparison does not mean discharge water is being compared like-for-like with tap water — discharge enters watercourses where it is diluted before any potential abstraction and treatment
- There is no specific UK regulatory limit for PFAS in industrial discharge water
Historic PFOA (1950s–2012)
Data from historical emissions figures reported to the Environment Agency. The Hillhouse site was operated by ICI from the 1950s to 1999, then by AGC Chemicals Europe from 1999 onwards. The total below covers the entire period under both operators:
- Total discharged from the site: 178,000 kg (178 tonnes) — FOI figures via Guardian/Watershed Investigations, 24 September 2024 (Guardian, 24 September 2024). A separate EA estimate of approximately 145,000 kg (75t water + 70t air) appears in Dalmijn et al. (2025). Both figures cover the full ICI and AGC period; the discrepancy between them has not been explained in public documents. Neither should be treated as definitive.
- To air: 49,100 kg [reported in Guardian/Watershed Investigations, 24 September 2024, citing FOI data — original EA document not independently verified]
- To water: 54,300 kg [as above]
- To landfill: 6,200 kg [as above]
- Incinerated: 5,100 kg [as above]
- Sent to customers: 63,300 kg [as above]
Note: PFOA was not manufactured at Hillhouse. It was imported as a processing aid — first by ICI (1950s–1999), then by AGC Chemicals Europe (1999–2012) — and discharged into the local environment over approximately 60 years. The 178-tonne total covers both operators. How much was discharged under each operator has not been broken down in publicly available documents.
Source: Historical discharge figures via Environment Agency Permit EPR/BU5453IY
Current EEA-NH4 Discharge
According to AGC Chemicals Europe's permit documentation:
EEA-NH4 is a fluorochemical used as a replacement for PFOA in manufacturing.
- Annual discharge: Around 800 kg per year (Chemical & Engineering News, May 2023). No specific limit is set for EEA-NH4 in the permit — the discharge point is classified as "uncontaminated"
- Daily average: Around 2.2 kg per day
- Destination: River Wyre
- Status: Operating under Environment Agency permit
Water Contamination Levels (2022–2023)
Independent testing of discharge water from the Hillhouse estate:
- PFOA detected: 12,100 to 20,624 ng/L — around 120 to 206 times the EU drinking water safety limit (Megson et al., Chemosphere 2024: 12,100 ng/L at River Wyre; Dalmijn et al., ES&T 2025, PMC12312159: 20,624 ng/L at W1 discharge point)
- EU drinking water standard: 100 ng/L for sum of 20 PFAS (Directive 2020/2184)
- EEA-NH4 detected: 1,744 ng/L at the W2 discharge point — the first environmental detection of EEA-NH4 anywhere in the world (Dalmijn et al., 2025). The W2 point is classified in the permit as "uncontaminated surface water and roof water."
- PFAS identified: Researchers found evidence of hundreds of possible PFAS compounds. Of these, 697 matched known PFAS signatures under one detection method — a smaller number were confirmed to a higher standard of certainty (Megson et al., 2024)
- Total organofluorine: Around 400,000 ng/L — about 4,000 times the EU drinking water standard (Megson et al., 2024)
Note on attribution: The W1 discharge point (showing 20,624 ng/L PFOA) is a shared discharge point used by both AGC Chemicals Europe and Victrex PLC (Dalmijn et al., 2025). The figure reflects combined output from both operations — it cannot be attributed to a single operator without further investigation. Organofluorine is a broader category of fluorine-containing compounds, including PFAS. These measurements are from discharge water, not drinking water supplies.
Sources: Guardian/Watershed Investigations, 2023; Dalmijn et al., ES&T 2025; Megson et al., Chemosphere 2024
Soil and Food Contamination Testing
Soil Testing Programme
Conducted by: Wyre Council multi-agency investigation (Environment Agency lead)
Timeline:
- Phase 1 (September–October 2024): 187 of 199 soil samples (~94%) showed elevated PFAS levels, up to 5km from the facility (WSP Phase 2 Factual Report, Section 2)
- Phase 2 (September 2024): 287 of 291 samples showed elevated levels (98.6% of samples)
- Peak detection: 144 µg/kg PFOA in residential soil at location GR01-SP232, 0.4–0.5m depth (WSP Phase 2 Factual Report, 17 July 2025)
- Phase 3 (February 2026): First confirmed residential property soil data. See below.
Scope: Investigation focused on soil-to-vegetables pathway
Attribution note: Soil contamination in the area may reflect contributions from multiple sources over decades. These include legacy ICI operations, current AGC operations, chemicals that settled from the air, and shared estate infrastructure. Source attribution has not been published.
Source: Wyre Council Phase 2 soil testing results, 2024-2025; Wyre Council Phase 3 letter ref 1908990571, February 2026Phase 3 — First Residential Soil Data (February 2026)
In February 2026, Wyre Council issued results from the first residential property tested under Phase 3 (WSP code: SP510). This is significant: Phases 1 and 2 only sampled council-owned land.
Key findings at SP510:
- 25 samples taken across the property
- All 25 exceeded the Dutch PFOA soil screening value of 3.8 µg/kg — the nearest available international benchmark (RIVM Soil Remediation Circular; this value has no legal force in England, which has no statutory PFAS soil limit)
- Range: 6.57 µg/kg to 119 µg/kg PFOA
- The highest reading (119 µg/kg, 31× the Dutch benchmark) was at 0.60m depth — the maximum depth sampled. Contamination was still rising when sampling stopped
Why the depth profile matters: At multiple sample points, PFOA increased with depth. This is the opposite of a surface-deposition pattern — it is consistent with PFAS-contaminated groundwater migrating laterally from the site, not only historic atmospheric deposition. Phases 1 and 2 showed the same pattern. The true depth of contamination remains unknown.
Residential Testing Programme — Overall Numbers (as of early March 2026)
71 residential properties in the area surrounding the Hillhouse estate have been tested as part of the Phase 3 investigation. Key findings:
- PFOA was found in the majority of properties tested
- 7 properties have been designated "high risk" based on soil contamination levels
- No residential property has yet received a formal Part 2A Contaminated Land designation
Wyre Council has stated that "no conclusions have been reached, nor any decisions made, regarding the Contaminated Land status of any other areas of land" beyond Occupation Road Allotments. The 7 high-risk designations are the council's internal risk classification — they do not carry the legal obligations that attach to a Part 2A determination.
Attribution note: Residential soil contamination in the area may reflect contributions from multiple sources over decades. Source attribution has not been published.
Source: Wyre Council multi-agency investigation updates; Wyre Council, 5 March 2026Food Safety Assessments — 2026
FSA Egg Advisory (2 February 2026):
- Affected area: 1km radius from Hillhouse estate boundary
- Advisory: Residents advised not to eat locally produced eggs or consume egg-laying poultry
- Reason: PFOS and PFOA levels exceed safe weekly consumption thresholds
Attribution note: The advisory references elevated PFOS levels. AGC's public position is that they have not used or manufactured PFOS [source to be confirmed]. The source of PFOS in local eggs has not been identified. PFOS has been subject to international restrictions under the Stockholm Convention since 2009. PFOS in the environment can originate from multiple sources — chemicals that settled from the air from other industrial sources, historical contamination from previous land uses, or transformation of precursor compounds (chemicals that can change into PFOS in the environment). The Hillhouse estate has been an industrial site since the 1950s with multiple operators and shared infrastructure. Without specific investigation, the source cannot be determined. This remains an open question under investigation by Wyre Council's multi-agency team.
Source: Food Standards Agency via Wyre Council, 2 February 2026Part 2A Contaminated Land Classification — Occupation Road Allotments (5 March 2026):
- The Environment Agency concluded Occupation Road Allotments meets statutory criteria for formal classification as Contaminated Land under Part 2A of the Environmental Protection Act
- Classification was based on PFOA found in both soil samples and produce grown on the site — not only surface soil
- Sandringham Avenue Allotments closed precautionarily pending further results
- New FSA advice for residents within 1km: consider raised beds with fresh soil when growing produce
The significance of produce contamination: PFAS contamination in vegetables is the result of root uptake — plants absorb these chemicals from soil and water as they grow, incorporating them into plant tissue. Washing and peeling removes surface soil particles (which do contain PFAS) but cannot remove PFAS already absorbed into plant tissue. The EA's produce findings are therefore distinct from soil contamination alone.
Source: Wyre Council, 5 March 2026 — "Further Steps Taken in Ongoing Multi-Agency Investigation"Permit Compliance Failures — September 2025
The following exceedances were recorded against AGC's Environment Agency permit in September 2025, for parameters that are monitored. The permit has no PFAS monitoring requirements on any of its 15+ air emission points.
| Parameter | Measured | Permit Limit | Exceedance |
|---|---|---|---|
| Dioxins | 0.37 ng/m³ TEQ | 0.1 ng/m³ TEQ | 3.7× over limit |
| Particulates | 1,407 mg/m³ | 30 mg/m³ | 47× over limit |
| Thermal oxidiser | Offline 43 days (Q1–Q2 2025) | — | Required abatement unit offline |
The thermal oxidiser is the device used to destroy PFAS and other pollutants in air emissions. What happened to PFAS air emissions during the 43 days it was offline has not been addressed in public statements.
Note on these figures: These are drawn from AGC's permit compliance data for September 2025. The units and measurement context should be confirmed against the primary EA permit document (EPR/BU5453IY) before use in any formal or legal context. They are presented here as indicative of the scale of exceedances recorded.
Source: AGC permit compliance data, EA Permit EPR/BU5453IY, September 2025Exposure Pathways Not Currently Assessed
The following have not been included in the current investigation:
- Air inhalation
- Drinking water contamination
- Dust ingestion
- Skin contact
- Indoor air from soil vapour
Blood testing: No biomonitoring programme (blood and urine testing to check for chemicals in the body) has been offered to residents.
Information Not Currently Available
The following data has not been published or does not appear to exist for the Hillhouse estate area:
- Groundwater testing: No published data on PFAS levels in groundwater beneath or adjacent to the estate
- Private water supply testing: No published data on PFAS levels in any private water supplies in the surrounding area
- Indoor dust testing: No data on PFAS levels in household dust in surrounding properties
- Air monitoring: No ongoing ambient air monitoring for PFAS around the estate perimeter
- Full chemical inventory: A complete list of all PFAS compounds used, stored, or discharged at the Hillhouse estate — across all operators, past and present — has not been published
- Source attribution study: No study has been published attributing specific contamination (soil, water, eggs) to specific operators or time periods on the estate
This information may exist in documents we haven't yet found, may be held by organisations that haven't published it, or may not have been collected. If you are aware of data that addresses any of these gaps, please get in touch. This site is a work in progress — we aim to present what is known, correct errors as we find them, and clearly mark what remains unknown.
European Site Comparison
Comparison of regulatory responses at documented PFAS discharge sites.
| Site | Country | Peak PFOA (ng/L) | Status | Regulatory Response |
|---|---|---|---|---|
| 3M Zwijndrecht | Belgium | Very high (contaminated groundwater) | Shut Down | Government-ordered shutdown (2021) |
| Hillhouse Estate | UK | 20,624 (discharge water — around 206× EU drinking water standard)* | Operating | Food advisory for 1km radius |
| DuPont Parkersburg | USA | ~13,000 (around 130× EU standard) [source to be confirmed] | Settled | EPA enforcement + litigation |
| Chemours Dordrecht | Netherlands | Variable | Remediating | Court-ordered soil replacement |
| Arkema Pierre-Bénite | France | Not disclosed | PFAS Ceased | Regulatory mandate enforced |
Restriction Zones — Scale Comparison
Each panel covers the same geographic area (50km × 50km). The coloured areas show the extent of testing, food restrictions, or health monitoring established by each country's authorities.
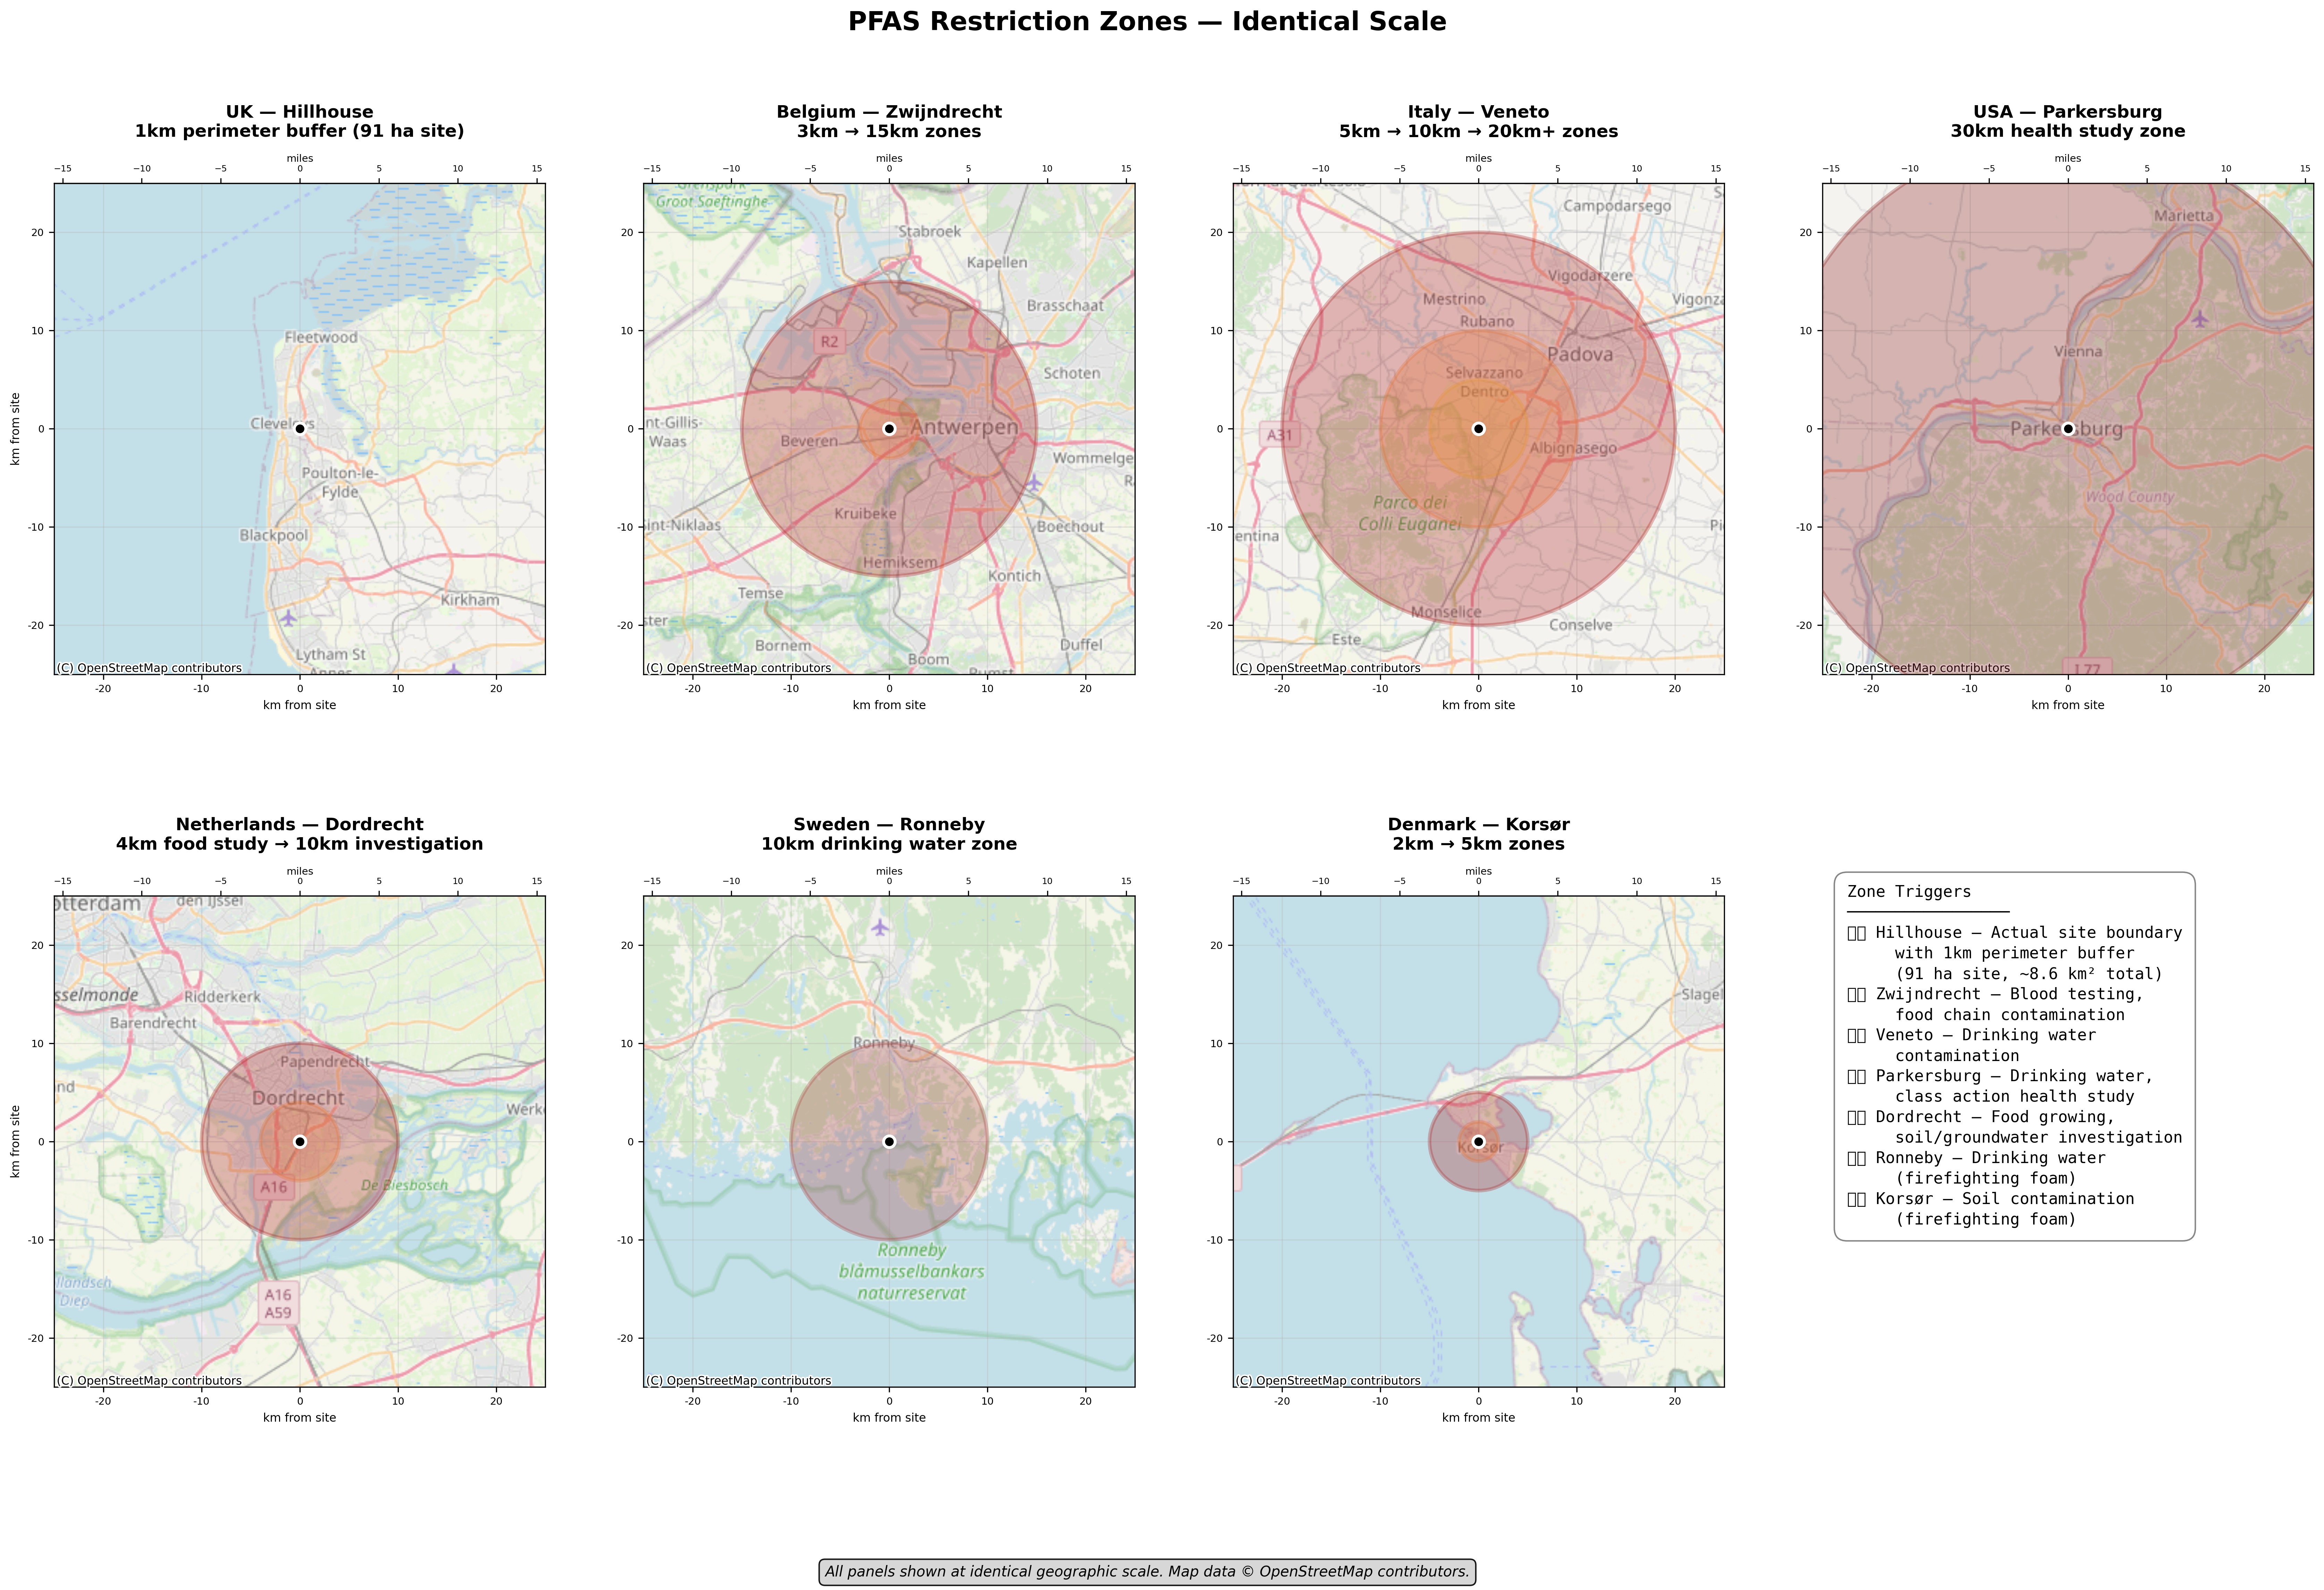
Map data © OpenStreetMap contributors. Zone sizes based on publicly documented regulatory actions at each site [specific regulatory documents for each country's zone sizes to be compiled]. Different sites were triggered by different contamination pathways.
The 1km Zone in Detail
Important: the map below is Hillhouse Watch’s interpretation, not the official FSA/Wyre advisory zone.
The Food Standards Agency and Wyre Council have described the 1km zone in at least three inconsistent ways across written communications (“from the estate boundary”, “from the Technology Enterprise Zone”, and “from the AGC Chemicals Europe facility”). In April 2026, Wyre Borough Council verbally stated that the zone is measured from the main stack — a fourth definition, not reflected in any published document or map. No official map of the advisory zone has been published. See our analysis post: The 1km Zone: Three Definitions, No Map, No Measurement Point.
The map below shows a 1km buffer drawn from the Hillhouse estate boundary perimeter. This is Hillhouse Watch’s best-effort interpretation of the earliest published written wording — it is not the official FSA/Wyre advisory zone as now verbally described (from the main stack). Of the approximately 8.6 km² total buffer area shown, 0.9 km² is the industrial estate itself. [Area calculations derived from mapped boundaries — methodology available on request.] A 1km radius measured from the main stack would produce a substantially different geographic footprint, with significant portions falling inside the industrial estate itself.
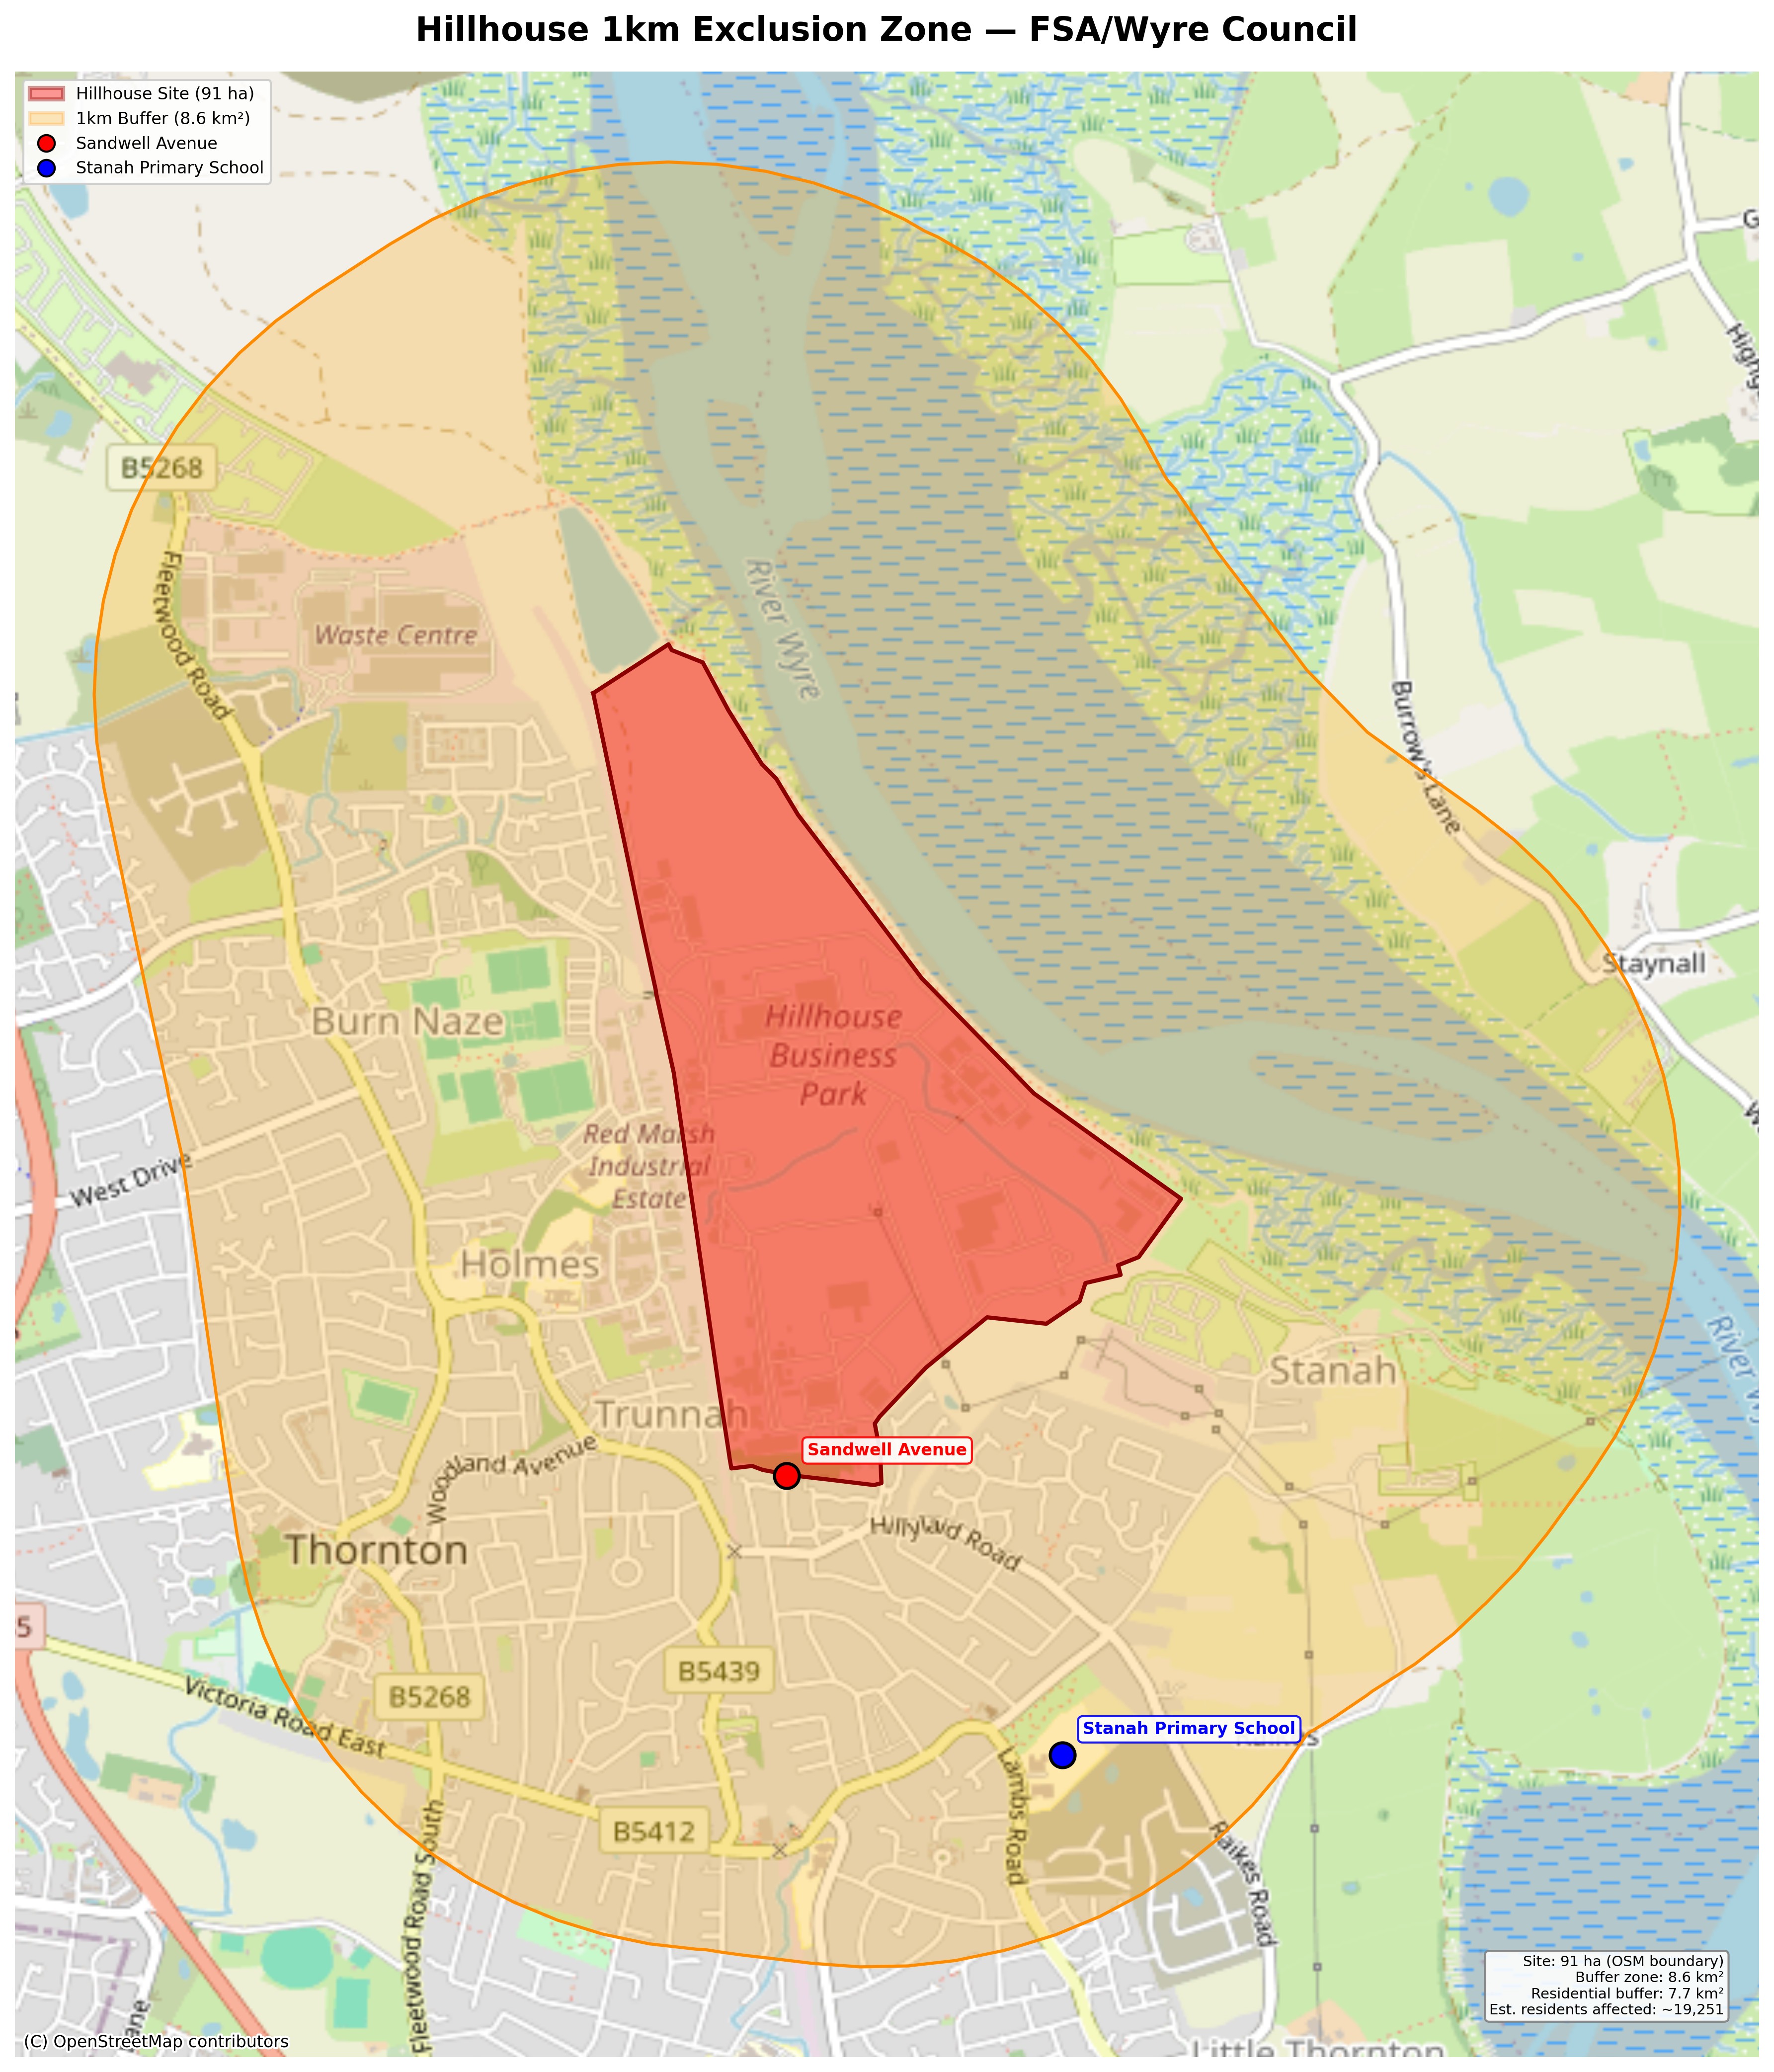
Hillhouse Watch interpretation — 1km buffer from the Hillhouse estate boundary perimeter. Not the official FSA/Wyre advisory zone. Map data © OpenStreetMap contributors.
Regulatory Responses by Country
*Note on EU standard comparison: The Hillhouse figure (20,624 ng/L) is from discharge water testing. The EU drinking water standard (100 ng/L) applies to treated drinking water at the tap. This comparison illustrates scale but these are different measurement contexts — discharge water is diluted in receiving watercourses before any potential abstraction and treatment.
Sources: Flemish Environment Agency (3M); Dutch Environmental Authority (Chemours); Arkema Corporate Statement (Pierre-Bénite)
What We Don't Know
The following questions remain unanswered in publicly available documents. These are not accusations — they are gaps in what we have been able to find in the public record.
- How many PFAS compounds have been used at Hillhouse? Testing has focused on a small number of known PFAS. Researchers have identified signatures of hundreds of possible PFAS compounds in discharge water. The full range of chemicals used across all operators over 70+ years has not been disclosed.
- What is in the Jameson Road landfill? The landfill adjacent to the estate received waste from ICI operations. A complete inventory of deposited materials has not been published. Whether it is a current source of contamination to groundwater or the River Wyre is not known.
- What are the cumulative effects? Toxicology data exists for individual PFAS compounds. Data on the combined effects of simultaneous exposure to multiple PFAS — which is the real-world exposure scenario for residents near Hillhouse — is limited.
- What is EEA-NH4 doing in the environment? AGC's own research classified EEA-NH4 as a Class 2 reproductive toxin (reprotoxic — meaning it may harm fertility or unborn children). Long-term environmental fate and accumulation data for EEA-NH4 is not publicly available.
- Who else has discharged what? The Hillhouse estate has hosted multiple operators since the 1950s. Discharge records for operators other than AGC are not readily accessible in the public domain.
The information may exist in documents we haven't located, it may be held by organisations that haven't published it, or it may not have been collected at all. If you know of sources that address any of these questions, please get in touch — this site is an ongoing effort to bring together what is known, correct what we've got wrong, and clearly identify what remains unknown.